Tracking: Get to Know your Mobile Visitors Following These 5 Metrics
In our post about understanding your mobile visitors, we discussed how important it is to consider your mobile visitors as a major part of your traffic and not just a side product and an uncomfortable necessity. But how do you really get to know your visitors? Through research, surveys and data. In this post we will learn how to understand 5 Google Analytics metrics at a higher level in order to learn more about and gather more info on your mobile visitors.
I am assuming, if you are reading this post, that you are collecting data from Google Analytics. But, it is important to note that collecting data in any form, from any technology you choose to use is extremely important. Using two ways to glean data and comparing them is the best practice. However, in this case, I will be discussing Google Analytics and you can apply this info to all data-tracking technologies that you have.
First thing is first though: You must check that your Google Analytics is set up and tracking properly.
So start by checking the basics:
- There is only one tag on all pages
- You are using the latest version of Google Analytics
- You have set up goals and are tracking them properly
- If relevant, you have set up E-commerce Tracking
If you are not tracking properly, your metrics won’t mean a thing and it will be a waste.
Once you have made sure that everything is being tracked properly, only then can you start analyzing your data in order to understand your users. Let’s discuss 5 important metrics to start with, and take a look at some of our examples from real Google Analytics accounts.
-
Audience Metrics: Who’s On Mobile?
First, let’s figure out what percentage of your traffic are on mobile.
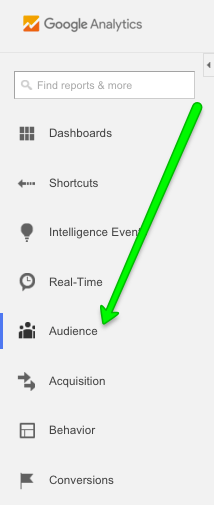
Go to Audience, in your Google Analytics Sidebar.
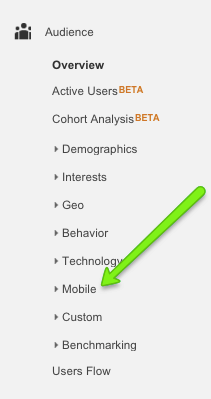
Then, click on Mobile (I know. Super unexpected…)
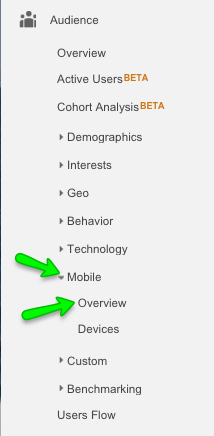
Next, let’s click on Overview.
Here we can compare what percentage of our traffic is going where:
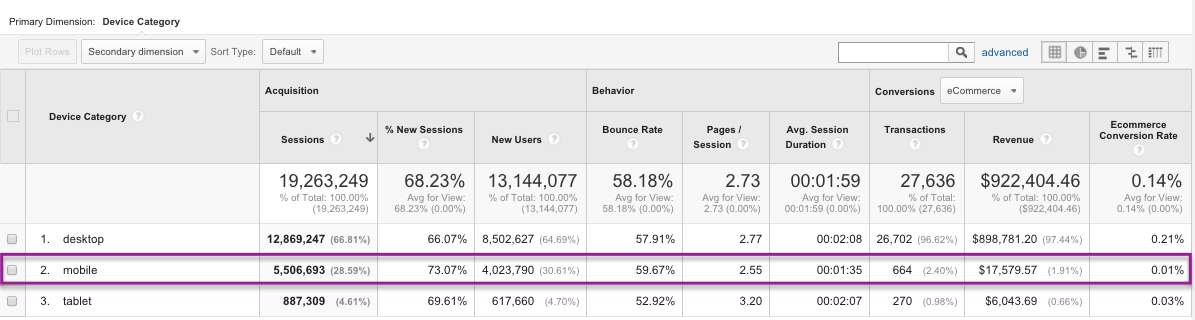
Here we can see that, for this website, 28.5% of traffic is from mobile and yet only 2.4% of transactions and only 1.9% of revenue are from mobile. That means that out of 527 people, only one person has registered from mobile. We have some work to do!
-
Audience Metrics: Devices and Browsers. – What are they using?
If we stay under Audience → Mobile, but this time we head to “Devices” we can see which devices individuals use in order to go to our mobile site.
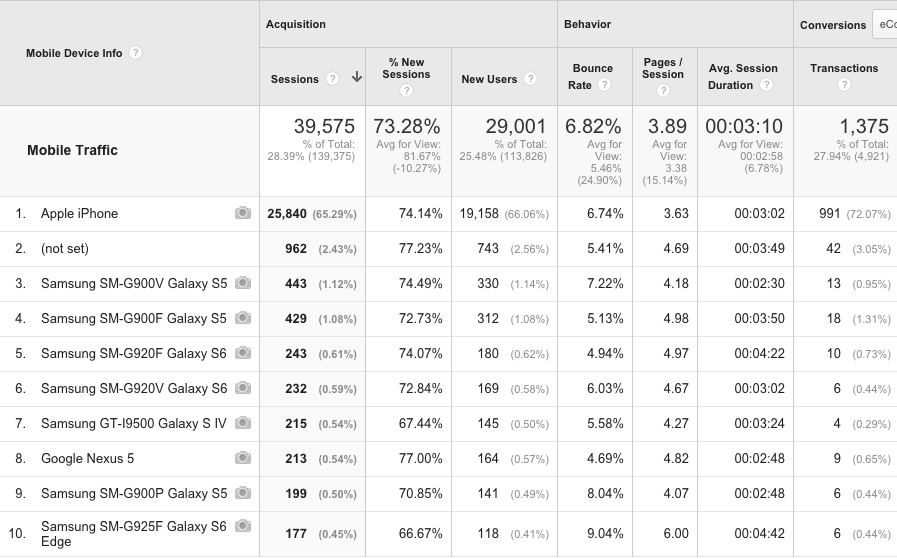
Here we can see that 65% of the mobile traffic are using Apple iPhones and that 72% of transactions are being made via the iPhone. With 443 sessions held from Samsung, only 13 transactions were completed. Here you could take a look at how the website works on Android and whether it has bugs via that system, or perhaps you can come to the conclusion that your users are iPhone users and develop an iPhone app for them.
For the next few metrics, there are a few ways to view them for your mobile users specifically.
One way to do it is:
Hover over the section: “All Sessions” and “+Add Segment”:
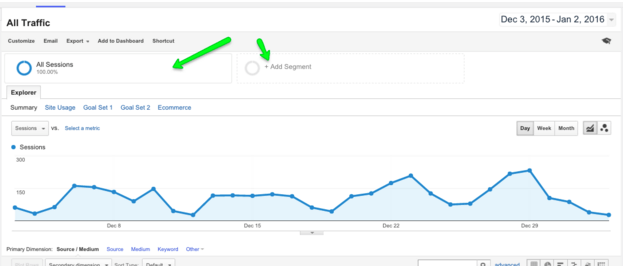
Click ‘Add Segment’ and the following window will appear:
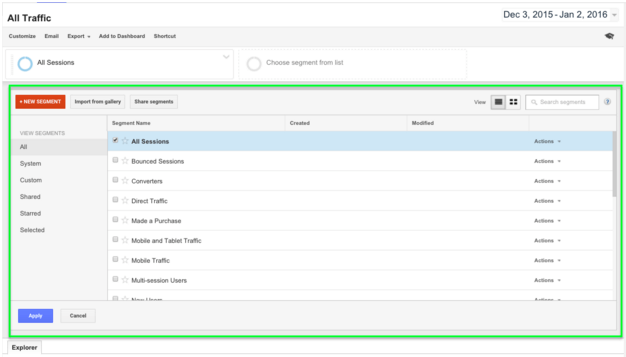
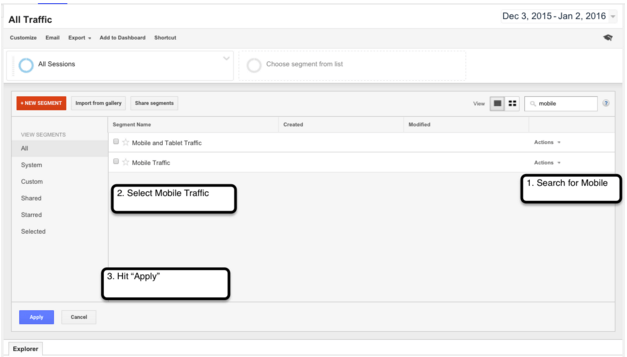
You can either create a segment or search for the segment name Mobile Traffic and select that – and then hit Apply:
From here on out, we will be using only the Mobile Traffic Segment to look at our metrics. We will remove “All Sessions” from our view for now.
-
Acquisition Metrics: Where are they coming from?
Now let’s look at our traffic.
We look at our traffic in order to understand how our users get to our site. Traffic is important because we can understand the mindset of our users when they get to our site. We can grasp how much they know about us, what they may be looking for, and what we should work on in order to increase the amount of users that come to our site.
For example, if you are running a campaign on facebook to bring users to your site, you want to know that the campaign is successful at not just bringing people in, but increasing conversions. If you see that a lot of people are coming in from the campaign but not registering or buying, you will want to investigate further – perhaps change your strategy. Or perhaps you wrote a guest post on another site and you’re seeing that the users coming from there are converting more than users from direct and you want to invest in more guest posts.
Knowing where your traffic is coming from and who of this traffic is converting can really help you optimize your strategy and improve conversions. Now let’s see where we can find this metric.
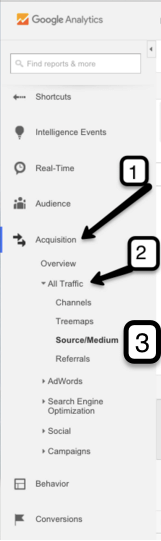
First go to Acquisition → All Traffic → Channels to get a better general understanding of your traffic.
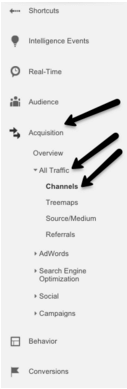
Here, you’re going to find 5 different channels. Always be skeptical of these channels as they include a variety of links that may be causing you to read misguided information. You’re going to want to look into every one of these and what they include further.
- Direct means people who arrived directly to your site – plugged in your URL to their browser bar and hit Go. There are several other types of traffic that Google will attribute to Direct Traffic such as improperly tagged marketing campaigns, whenever a referrer is not passed, word/PDF documents that link the the side, and some redirects.
- Next, you have Referral traffic. This generally includes people who were referred to you from other sites (but at times may include “Paypal” as a referrer because someone was on your site, paid through paypal, and returned to your confirmation page).
- Social means Twitter, Facebook, Linkedin and everything that counts as social. Though sometimes you’ll find some of your social links under the referral channel so keep an eye out.
- Organic Search means anyone who searched on Bing, Yahoo, or Google, and clicked your site from their search results.
- And then there’s Other which you can look and see what they mean and why. They’re usually just misunderstood.
To get a deeper grasp of Traffic, I never leave Google Analytics without clicking on “Source/Medium” under Acquisition→ All Traffic.
This metric allows you to see the specific referrals that are most popular and bring the most people in (remember – we are looking specifically at the Mobile Traffic Segment). You can see that, for example, google/organic brought in specifically 7.40% of mobile traffic and Facebook referral brought in 8.35% of traffic, but that neither of them brought in a Registration.
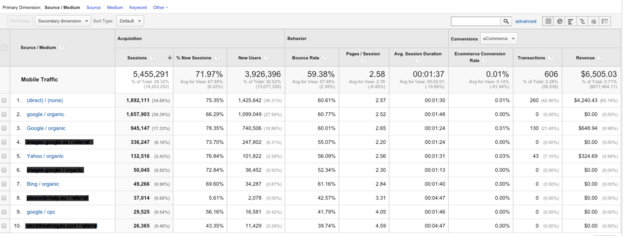
So now we know that while our facebook referrals from mobile are bringing in users, they aren’t bringing in the kinds of users we want, or perhaps we need to work on clarifying our mobile site.
-
Behavior Metrics: Site Content – What are they looking at?
Now that we know how much of our traffic is on mobile, where this mobile traffic is coming from, and which mobile traffic is converting most, let’s see what your mobile users are doing on your site.
Go to Behavior in GA’s sidebar and select Site Content as we want to see what site content our users are viewing.
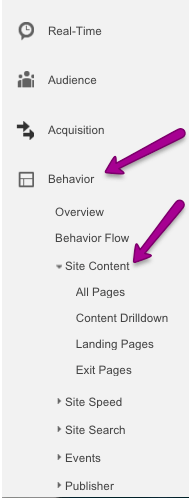
- All Pages: First, click on All Pages to see which are the most popular pages that visitors view on your mobile site. You may be surprised at what pages all of your mobile visitors are using. You are going to want to work on optimizing those, especially if you find that, say, 70% of your visitors are viewing a certain page that is just responsive, and the bounce rate is 97%. You may want to make sure that page is optimized for the mobile screen and, depending on that page, that it is clear what you want the user to do on it. You can also check your most popular products this way. At times, you may find that one page is most popular on desktop however is not as popular on mobile.
Once you’ve identified your top pages and those that need optimizing , you can use different splashes to make your conversion goal clearer to your users. For example, if you are attempting to generate more leads on your homepage, you can create a dedicated splash with a special deal for those customers.
You can also make sure only new users see this special offer, and even further personalize it so that only new users from the USA receive this message while users from the UK receive a different discount, and users from China receive a complete different personalized message as well.
- Landing Pages: Next, go to Landing Pages. Why – you may ask? Because first impressions are important! And you have to know what sort of first impression you are making on your users. Landing pages show you the top 10 pages that most of your users land on when arriving at your site. Read this list of top 10 (or 20 or 30) most common landing pages of your visitors and view which ones get the most traffic, and which get the most time spent, and which are reaching your goals. If you are a content site, you’re going to want to see people spending a longer amount of time, on average, on your pages, and registrations to your newsletter. If you’re an ecommerce site, you’re going to want to see which landing pages led to the most purchases. Depending on your mobile conversion goal, read this list and see how you can optimize your landing pages in order to get the most out of your mobile site.
- Exit Pages: Another content aspect to look at is the Exit Page metric (which is also under Site Content). The exit page is a page on your site from which your users are leaving. If your exit pages and your landing pages are one and the same, you will see which pages are engaging and causing users to click through, and which pages people just leave from. Then you can look at your actual page and try to identify why people are leaving. There may, in fact, be completely legitimate reasons for people to exit. For example, if your thank you confirmation page is your number one exit page, you are in a good place! You should examine the nature of your page before reaching conclusions about it. If your page is a blog post someone searched for online and they left, it is a completely natural reason! But if it is your checkout form from which people are exiting, you should take a closer look, and consider making some optimization changes to that page. The causes may be a slow loading time, spelling mistakes, lack of trust, and a plethora of other reasons, so examine and start testing!
-
Behavior Metrics: Site Speed – Let’s get technical
The last metric we will cover today is also under the Behavior section of your GA Sidebar, but this time, we are looking at the technical side of things. Sometimes we blame our website design, color, imagery, button copy or other various objects on our page in the lack of conversions. But sometimes, the lack of conversions can come from a completely technical reason. First of all, always QA every change you make on your site both on desktop and on mobile. But back to Google Analytics, site speed also has an incredible impact on your users!
Site Speed, which you can find under Behavior→ Site Speed, tells you how long it takes your site to load on each browser. This may be one of the first things you want to test when analyzing data.
Go to Behavior → Site Speed → Page Timings to see what pages load slowest and fastest on your mobile site. Of course this may vary between devices, which is why you may want to add “Device” as your secondary dimension.
Personally, I made my Secondary Dimension “Browser” so that I could see what pages load slowest and fastest on which browsers, so that I can see what I need to optimize.
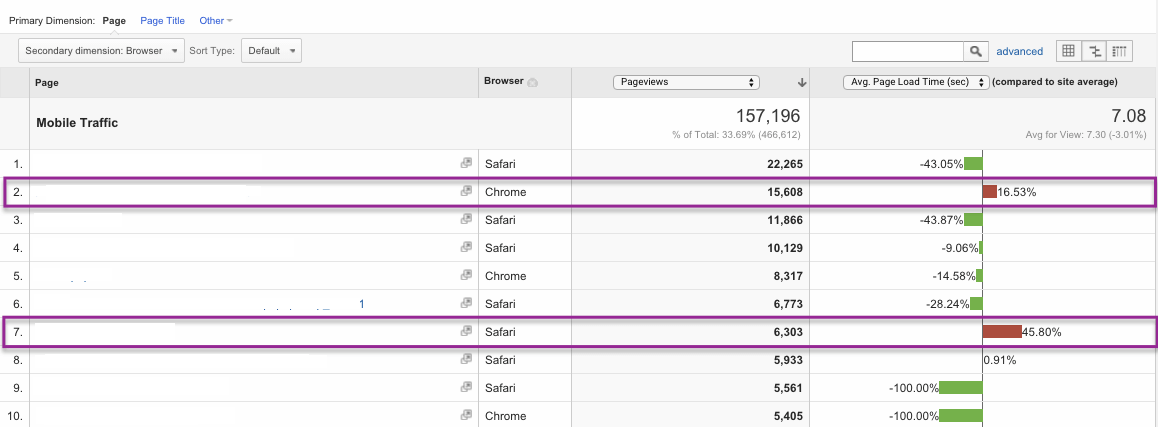
Here you can see that the #2 most popular page, that gets a large percentage of mobile traffic, is loading 23% slower than average on the Chrome Browser, and that page #7 in most traffic is 45% slower than other pages when loading on Safari. Because Chrome and Safari are my most popular browsers, I really need to get to work on optimizing those pages!
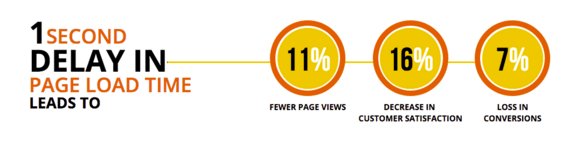
Research shows that even a 1 second delay in page load time leads to fewer page views, a 16% decrease in customer satisfaction, and a 7% loss in conversions. So if you’re thinking “oh come on, it’s just one second” – think again.
There are so many different metrics on Google Analytics you should look into, like Conversion Rate, Goal Achievement, popular browsers, and demographics in order to learn even more about these different, varied, and interesting mobile visitors and what they like and dislike. For example, using demographics, you can see that while more men are visiting your site, perhaps the 30% of women are converting far more. Perhaps you should work on bringing in more female traffic, or perhaps something about your pages is not as appealing to men for completing purchases.
All of these are things you need to take into account when approaching your Google Analytics data, or other data you are collecting on your users. Data driven AB testing will lead to far greater results than gut feeling driven AB testing, so I highly recommend it. So once you’ve reviewed these metrics,identified the behaviors of your visitors and deduced and hypothesized what your customers are looking for, you can focus on delivering a personalized experience. You can do this by creating dedicated landing pages for your users, targeted at where they came from and what their goals are, and by using Banana Splash. With Banana Splash, you can AB test different messages, and combined with these metrics, continuously test and see which messages get the greatest conversions from your mobile visitors.
Need help building a strategy or figuring out what you want to do with this data? Reach out and ask! We are here to help.


3 Comments. Leave new
Great guide!
Helped me to understand the traffic of my client’s site
Thanks for putting this together and explaining basic yet relevant analytics in simple terms! I was wondering forever regarding GA’s Landing / Exit Page feature but now I know what to look for in optimizing our travel blog 😉
This is really a very comprehensive guide, thank you.