As an SEO, whether you’re working in-house or handling many clients in an agency, you’ve likely been using this tool for a bunch of reasons. Whether it’s diagnosing traffic and position changes or finding opportunities for optimizations and content ideas, Google Search Console’s Search Search Analytics has been at the core of most SEOs’ toolset.
The scope of this small guide is to give you a few ideas on how to use Search Analytics together with Google Sheets to help you in your SEO work. As with the guide on how to do competitive analysis in Excel, this one is also focused around a tool that I’ve built to help me get the most of Search Analytics: Search Analytics for Sheets.
The problem with the Search Analytics UI
Sorting out and managing data in the Google Search Console Search Analytics web UI in order to get meaningful insights is often difficult to do, and even the CSV downloads don’t make it much easier.
The main problem with the Search Analytics UI is grouping.
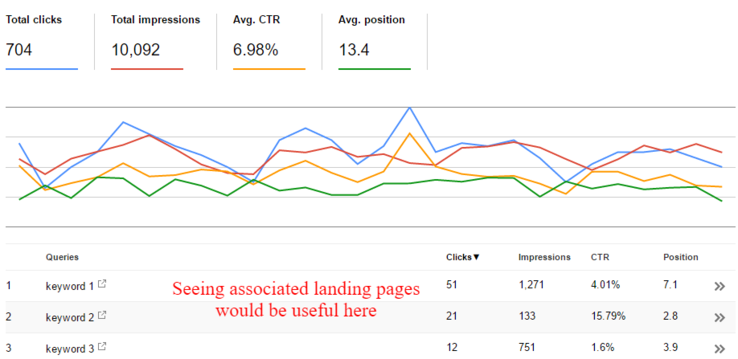
If you’d like to see a list of all the keywords in Search Analytics and, at the same time, get their corresponding landing pages, you can’t do that. You instead need to filter query-by-query (to see their associated landing pages), or page-by-page (to see their associated queries). And this is just one example.

Basically, with the Search Analytics UI, you can’t do any sort of grouping on a large scale. You have to filter by each keyword, each landing page, each country etc. in order to get the data you need, which would take a LOT of time (and possible a part of your sanity as well).
In comes the API for the save
Almost one year ago (and after quite a bit of pressure from webmasters), Google launched the official API for Search Analytics.

With it, you can do pretty much anything you can do with the web UI, with the added benefit of applying any sort of grouping and/or filtering.
Excited yet?
Imagine you can now have one column filled with keywords, the next column with their corresponding landing pages, then maybe the next one with their corresponding countries or devices, and have impressions, clicks, CTR, and positions for each combination.
Everything in one API call
Getting the data into Google Sheets
I have traditionally enjoyed using Excel but have since migrated over to Google Sheets due to its cloud nature (which means easier sharing with my co-workers) and expandability via scripts, libraries, and add-ons.
After being heavily inspired by Seer Interactive’s SEO Toolbox (an open-source Google Sheets library that offers some very nice functions for daily SEO tasks), I decided to build a Sheets script that would use the Search Analytics API.
I liked the idea of speeding up and improving my daily monitoring and diagnosing for traffic and ranking changes.
Also, using the API gave me the pretty useful feature of automatically backing up your GSC data once a month. (Before, you needed to do this manually, use a paid Sheets add-on or a Python script.)
Once things started to take shape with the script, I realized I could take this public by publishing it into an add-on.
What is Search Analytics for sheets?
Simply put, Search Analytics for Sheets is a (completely free) Google Sheets add-on that allows you to fetch data from GSC (via its API), grouped and filtered to your liking, and create automated monthly backups.
If your interest is piqued, installing the add-on is fairly simple. Either install it from the Chrome Web Store, or:
- Open a Google spreadsheet
- Go to Add-ons -> Get add-ons
- Search for Search Analytics for Sheets
- Install it (It’ll ask you to authorize a bunch of stuff, but you can sleep safe: The add-on has been reviewed by Google and no data is being saved/monitored/used in any other way except grabbing it and putting it in your spreadsheets).
Once that’s done, open a spreadsheet where you’d like to use the add-on and:

- Go to Add-ons -> Search Analytics for Sheets -> Open Sidebar
- Authorize it with your GSC account (make sure you’re logged in Sheets with your GSC account, then close the window once it says it was successful)
You’ll only have to do this once per user account, so once you install it, the add-on will be available for all your spreadsheets.
PS: You’ll get an error if you don’t have any websites verified on your logged in account.
How Search Analytics for Sheets can help you
Next, I’ll give you some examples on what you can use the add-on for, based on how I mainly use it.
Grab information on queries and their associated landing pages
Whether it is to diagnose traffic changes, find content optimization opportunities, or check for appropriate landing pages, getting data on both queries and landing pages at the same time can usually provide instant insights. Other than automated backups, this is by far the feature that I use the most, especially since it’s fairly hard to replicate the process using the standard web UI.
Best of all, it’s quite straightforward to do this and requires only a few clicks:
- Select the website
- Select your preferred date interval (by default it will grab the minimum and maximum dates available in GSC)
- In the Group field, select “Query,” then “Page”
- Click “Request Data”
That’s it.
You’ll now have a new sheet containing a list of queries, their associated landing pages, and information about impressions, clicks, CTR, and position for each query-page pair.

What you do with the data is up to you:
- Check keyword opportunities
Use a sheets filter to only show rows with positions between 10 and 21 (usually second-page results) and see whether landing pages can be further optimized to push those queries to the first page. Maybe work a bit on the title tag, content and internal linking to those pages.
- Diagnose landing page performance
Check position 20+ rows to see whether there’s a mismatch between the query and its landing page. Perhaps you should create more landing pages, or there are pages that target those queries but aren’t accessible by Google.
- Improve CTR
Look closely at position and CTR. Check low-CTR rows with associated high position values and see if there’s any way to improve titles and meta descriptions for those pages (a call-to-action might help), or maybe even add some rich snippets (they’re pretty effective in raising CTR without much work).
- Find out why your traffic dropped
- Had significant changes in traffic? Do two requests (for example, one for the last 30 days and one for the previous 30 days) then use VLOOKUP to compare the data.
- Positions dropped across the board? Time to check GSC for increased 4xx/5xx errors, manual actions, or faulty site or protocol migrations.
- Positions haven’t dropped, but clicks and impressions did? Might be seasonality, time to check year-over-year analytics, Google Trends, Keyword Planner.
- Impressions and positions haven’t dropped, but clicks/CTR did? Manually check those queries, see whether the Google UI has changed (more top ads, featured snippet, AMP carousel, “In the news” box, etc.)
I could go on, but I should probably leave this for a separate post.
Get higher granularity with further grouping and filtering options
Even though I don’t use them as much, the date, country and device groupings let you dive deep into the data, while filtering allows you to fetch specific data to one or more dimensions.

Date grouping creates a new column with the actual day when the impressions, clicks, CTR, and position were recorded. This is particularly useful together with a filter for a specific query, so you can basically have your own rank tracker.
Grouping by country and device lets you understand where your audience is.
Using country grouping will let you know how your site fares internationally, which is of course highly useful if you target users in more than one country.
However, device grouping is probably something you’ll play more with, given the rise in mobile traffic everywhere. Together with query and/or page grouping, this is useful to know how Google ranks your site on desktop and mobile, and where you might need to improve (generally speaking you’ll probably be more interested in mobile rankings here rather than desktop, since those can pinpoint problems with certain pages on your site and their mobile usability).

Filtering is exactly what it sounds like.
Choose between query, page, country and/or device to select specific information to be retrieved. You can add any number of filters; just remember that, for the time being, multiple filters are added cumulatively (all conditions must be met).

Other than the rank tracking example mentioned earlier, filtering can be useful in other situations as well.
If you’re doing a lot of content marketing, perhaps you’ll use the page filter to only retrieve URLs that contain /blog/ (or whatever subdirectory your content is under), while filtering by country is great for international sites, as you might expect.
Just remember one thing: Search Analytics offers a lot of data, but not all the data. They tend to leave out data that is too individual (as in, very few users can be aggregated in that result, such as, for example, long tail queries).
This also means that, the more you group/filter, the less aggregated the data is, and certain information will not be available. That doesn’t mean you shouldn’t use groups and filters; it’s just something to keep in mind when you’re adding up the numbers.
Saving the best for last: Automated Search Analytics backups
This is the feature that got me into building this add-on.
I use GSC data quite a bit, from client reports to comparing data from multiple time periods. Unless you’ve never used GSC/WMT in the past, it’s highly unlikely you don’t know that the data available in Search Analytics only spans about the last 90 days.
While the guys at Google have mentioned that they’re looking into expanding this window, most SEOs have had to rely on various ways of backing up data in order to access it later.
This usually requires either remembering to manually download the data each month, or using a more complicated (but automated) method such as a Python script.
The Search Analytics for Sheets add-on allows you to do this effortlessly.
Just like when requesting data, select the site and set up any grouping and filtering that you’d like to use. I highly recommend using query and page grouping, and maybe country filtering to cut some of the noise.
Then simply enable the backup.
That’s it.The current spreadsheet will host that backup from now on, until you decide to disable it.

What happens now is that once per month (typically on the 3rd day of the month) the backup will run automatically and fetch the data for the previous month into the spreadsheet (each month will have its own sheet).
In case there are delays (sometimes Search Analytics data can be delayed even up to a week), the add-on will re-attempt to run the backup every day until it succeeds.
It’ll even keep a log with all backup attempts, and send you an email if you’d like.

It’ll also create a separate sheet for monthly aggregated data (the total number of impressions and clicks plus CTR and position data, without any grouping or filtering), so that way you’ll be sure you’re ‘saving’ the real overview information as well.
If you’d like more than one backup (either another backup for the same site but with different grouping/filtering options or a new backup for a different site), simply open a new spreadsheet and enable the backup there. You’ll always be able to see a list with all the backups within the “About” tab.
For the moment, only monthly backups are available, though I’m thinking about including a weekly and/or daily option as well. However that might be more complicated, especially in cases where GSC data is delayed.
Going further
I hope you’ll find the tool as useful as I think it is.
There may be some bugs, even though I tried squashing them all (thanks to Russ Jones and Tori Cushing, Barry Schwartz from Search Engine Roundtable, and Cosmin Negrescu from SEOmonitor for helping me test and debug it).
If you do find anything else or have any feature requests, please let me know via the add-on feedback function in Google Sheets or via the form on the official site.
If not, I hope the tool will help you in your day-to-day SEO work as much as it helps me. Looking forward to see more use cases for it in the comments.
PS: The tool doesn’t support more than 5,000 rows at the moment; working on getting that improved!